Ultrasound Engineering
Ultrasound OEM streaming: make dropped captures observable
A research-led OEM guide to capture identity, sustained payload delivery and recovery tests, with a reproducible illustrative buffer calculation and explicit research limitations.
By ALEVA · California, USA
The engineering question is not only whether an ultrasound front end can digitize quickly. Can the host identify what arrived, what went missing and how the pipeline recovered? A throughput demonstration without capture identity can conceal a data-loss problem even when the display looks continuous. This guide proposes an OEM acceptance workflow for that boundary, not a performance claim about a particular product.
Keep research examples in their proper scope
Kindorf and colleagues published a peer-reviewed multichannel acquisition study in May 2026. Its experimentally characterized photoacoustic receive chain is a useful public example of gain and acquisition engineering; it is not evidence that ALEVA implements the design, nor a complete pulse-echo scanner specification. Read its operating conditions before transferring a result into another system requirement. Kindorf et al., DOI 10.5194/jsss-15-89-2026.
NVIDIA's Sensor Bridge latency documentation distinguishes sensor-side and host-side timestamps. Its validation examples use frame numbers and integrity checks to identify missing data and timestamp problems. These are manufacturer transport examples, including camera applications, not ultrasound clinical-validation studies. Their practical relevance here is the separation of capture identity, delivery and processing—not proof that the same interface fits every ultrasound architecture. Latency documentation; validation examples.
Calculate payload, then calculate a pause
For equally sized captures, define the independent exported channel count N, stored samples per channel S, stored bytes per sample B and capture-event rate F. Payload per event is NSB bytes; average payload generation is R = NSBF bytes/s. Use the stored representation, not merely the ADC resolution. Headers, padding, metadata and transport overhead belong in the subsequent budget.
Illustrative assumptions: 64 exported channels, 2,048 samples per channel, two stored bytes per sample and 100 equal captures per second. No compression, upstream combination, reuse or variable capture size is assumed.
Calculated quantity | Illustrative result |
|---|---|
Payload per capture: 64 × 2,048 × 2 | 262,144 bytes |
Payload generation: 262,144 × 100 | 26,214,400 bytes/s = 25 MiB/s |
Additional backlog during a 0.25 s host-service pause: R × 0.25 | 6,553,600 bytes = 6.25 MiB |
The pause calculation assumes capture continues while no data leave the queue. It is an additional-backlog estimate, not a sufficient buffer guarantee: existing occupancy, bursts, allocation rules and overhead are omitted. If capture throttles or stops instead, the acceptance test must record that behavior. A buffer can absorb a finite pause, but cannot fix an indefinitely slower downstream service rate. After recovery, backlog drains only when service exceeds continuing generation, under the stated queue model.
For an additional reproducible recovery example, assume payload generation remains R = 25 MiB/s and payload service resumes at a constant C = 40 MiB/s. With only the 6.25 MiB pause backlog present, the net drain rate is C − R = 15 MiB/s and the ideal drain time is 6.25/15 = approximately 0.417 s. This constant-rate queue calculation is not a measured recovery time or a sufficient buffer specification. It omits pre-existing occupancy, bursts, overhead and scheduling variability. If C equals R, the backlog does not drain in this model; if C is below R, it grows. Any deliberate capture throttling changes the assumptions and must be recorded.
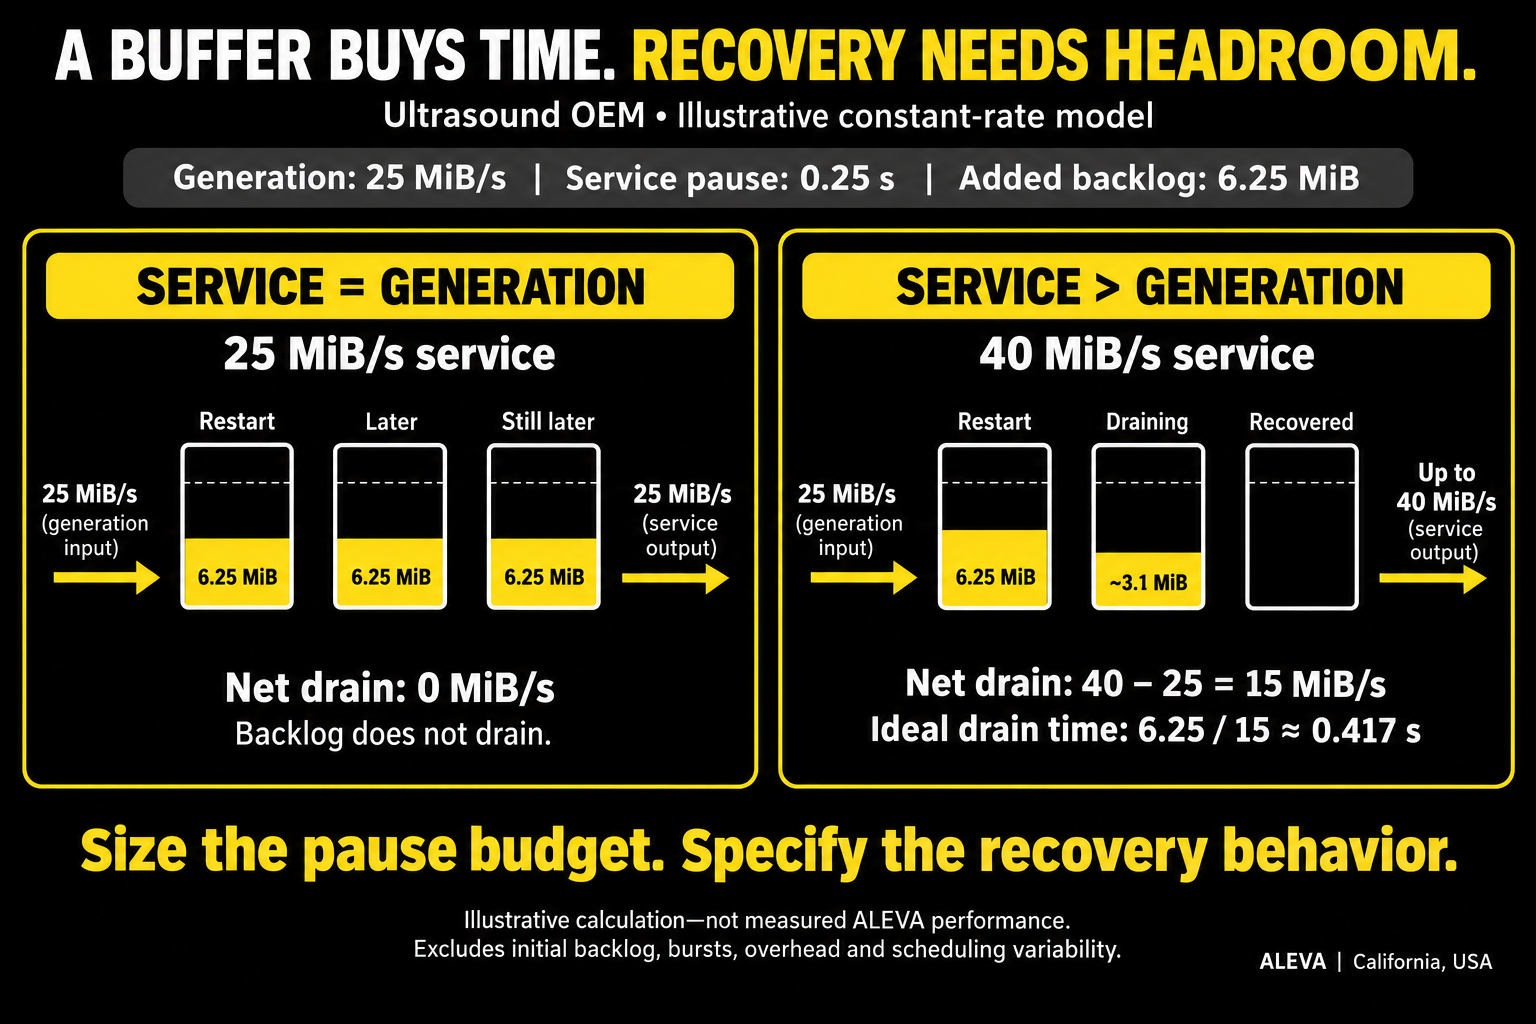
Figure 1. AI-generated conceptual comparison, not measured ALEVA performance. With continuing generation of 25 MiB/s, a 0.25 s service pause adds 6.25 MiB of backlog. Equal service leaves it unchanged; 40 MiB/s service capacity provides 15 MiB/s net drain and an ideal additional-backlog drain time of approximately 0.417 s after restart. The intermediate ~3.1 MiB level is an approximate halfway illustration, not a timed sample. Excludes initial backlog, bursts, overhead and scheduling variability.
Make loss and recovery independently testable
Proposed acceptance tests should distinguish missing, duplicated, late and out-of-order captures. Attach an event identifier and an explicit session or restart identifier; define whether counters restart or wrap. Specify the channel map, sample representation and calibration/configuration version that make the payload interpretable. A checksum can detect covered-byte corruption, but does not prove correct channel mapping or calibration.
Record generated-event and delivered-event counts separately. Test an intentional host-service pause with a bounded duration, then inspect queue occupancy, loss reports and recovery order. State whether the system drops old captures, drops new ones, throttles acquisition or reports an error. The intended application determines which behavior is acceptable; an apparently smooth display does not establish lossless acquisition.
Measure receive completion, host availability, reconstruction completion and displayed-frame availability separately. Timestamps from different clock domains require documented alignment or a measured offset model before subtraction produces meaningful latency. Report test duration and observed latency distributions alongside sustained payload delivery; do not substitute a peak link rate for these measurements.
What the OEM/ODM agreement should capture
The deliverable is a measurable data-interface contract: supported capture schedules, payload format, identity and restart rules, overflow policy, observable errors, clock assumptions and agreed recovery tests. Raw RF, demodulated IQ and upstream combined outputs are different inputs; confirm the exported representation before choosing an algorithm or data-rate budget. Reducing the transmitted payload may reduce transport demand while also constraining downstream analysis.
Discuss these boundaries alongside ALEVA's ultrasound OEM development scope and beamformer engineering. This proposed workflow uses public references and reproducible arithmetic. It does not assert deployment of NVIDIA software, the published research design or any clinical capability in an ALEVA commercial product.
References and limits
Kindorf S. et al., Towards high-frame-rate data acquisition for ultrasound and photoacoustic imaging with high signal-to-noise ratio, Journal of Sensors and Sensor Systems 15, 89–97, published May 28, 2026. DOI 10.5194/jsss-15-89-2026. Peer-reviewed research.
NVIDIA, Sensor Bridge latency and examples. Rolling manufacturer documentation rechecked October 13, 2026; current documentation index labels Sensor Bridge 2.7 as latest. This access date is not a research publication date or a guarantee of compatibility with a specific SDK release.
No patient data, private architecture, confidential code, customer information or unpublished ALEVA measurements were used. The numeric table is an illustrative calculation from stated assumptions, not a hardware benchmark.