Ultrasound Engineering
Ultrasound Slice Thickness: Specify the Response and the Threshold
A source-led probe-design review of elevational response, measurement thresholds and depth coverage, with an exact Gaussian illustration and a proposed OEM acceptance record.
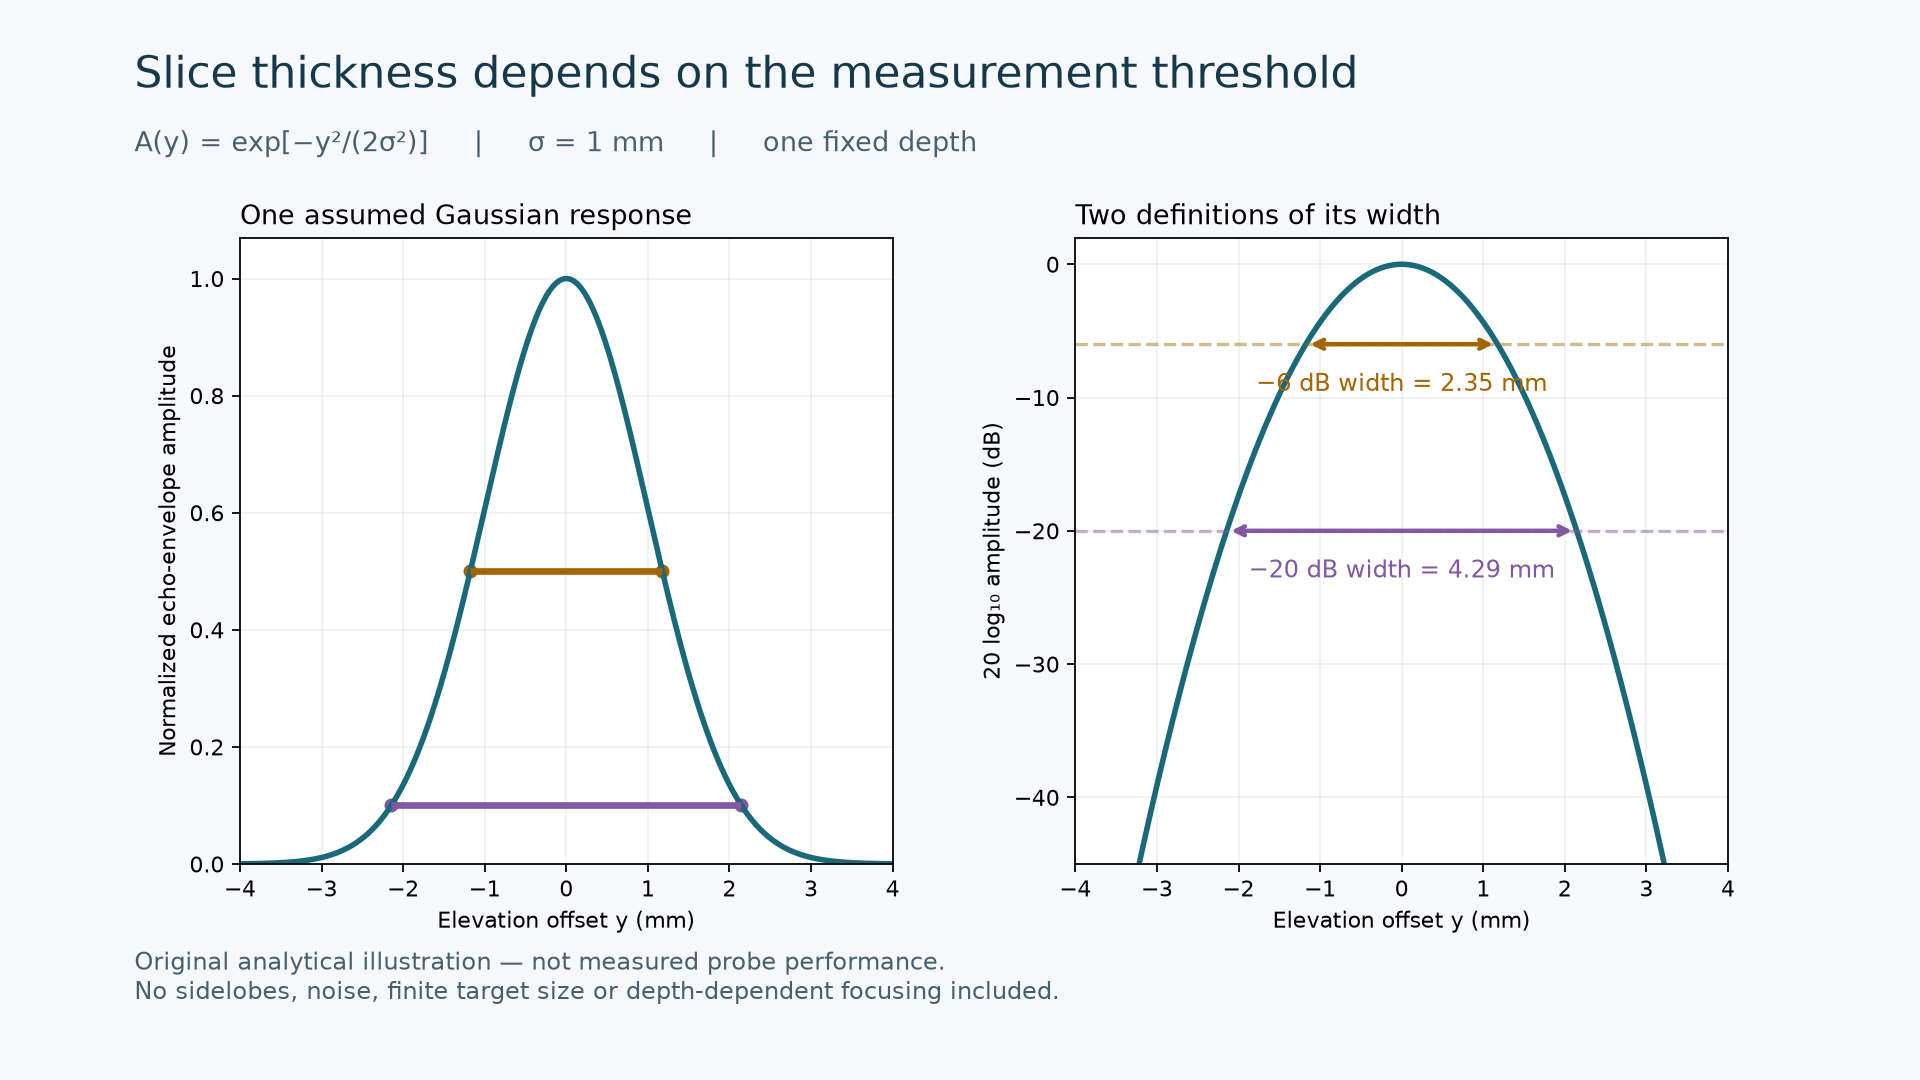
Original analytical illustration — not measured probe performance.
Engineering question: When a custom ultrasound probe is described as having a thin imaging slice, which response, depth and measurement threshold does that number describe?
For a conventional one-dimensional array with a fixed elevational lens, a satisfactory in-plane image does not fully characterize the out-of-plane response. Jackson and Russell describe how elevational aperture and lens focus determine slice thickness and its depth dependence. Their 2019 study measured linear-probe slice thickness using controlled translation across phantom filaments. It is useful measurement literature, not a new product announcement. [1]
Define the quantity before comparing probes
We propose separating three quantities in an OEM specification: the spatial acoustic field measured with a receiver such as a hydrophone; the pulse-echo response to a defined target; and the visible thickness of a feature in a processed B-mode image. A test report should state which quantity was measured. Without a documented relationship between them, agreement in one should not be accepted as evidence of agreement in all three.
Recent work also shows why the test geometry matters. Liu and colleagues published a ring-array ultrasound computed tomography phantom study on November 7, 2026, with separate modules for spatial resolution, slice thickness and volumetric accuracy. The authors explicitly limit their demonstration to one ring-array system and state that repositioning repeatability was not evaluated. Those results do not supply a universal acceptance limit for a linear custom probe. [2]
An unchanged response can produce different width numbers
Consider an illustrative normalized echo-envelope amplitude A(y) = exp[-y²/(2σ²)] at one fixed depth, where y is elevation offset and σ = 1 mm. This is an assumed Gaussian response, not a measured acoustic field or a model fitted to an ALEVA probe. Define the displayed level as L(y) = 20 log10 A(y). At a threshold of −D dB, solving L(y) = −D gives the full width W(D) = 2σ sqrt[D ln(10)/10].
The resulting width is 2.35 mm at −6 dB and 4.29 mm at −20 dB. The ratio is sqrt(20/6), approximately 1.83. Both numbers describe exactly the same assumed response: only the threshold changed. The figure plots that response and the two width intervals. A different Gaussian parameter changes both widths proportionally; neither value is a proposed product requirement.
For reproducibility, evaluate y from −4 to +4 mm, calculate the exponential above, and convert amplitude with 20 log10. If power is reported instead, define P = A² and use 10 log10 P; this gives the same level. Applying 10 log10 directly to amplitude changes the convention. The model omits sidelobes, finite target dimensions, noise, aberration and depth-dependent focusing, so it cannot establish contrast, target detectability or a safe operating limit.
Decide whether the solution belongs in the probe or the acquisition
Murakami and colleagues' March 2025 IEEE Access paper evaluates elevational synthetic aperture focusing for a rotating array using in-plane beamformed RF data. It combines information from different acquisition positions, adding reconstruction work and geometric requirements. This is published research, not evidence that an arbitrary single B-mode frame contains enough information for equivalent refocusing. Its results should be evaluated in the acquisition geometry for which the method was developed. [3]
For a custom development decision, compare a probe-focused route with a sequence-and-reconstruction route using the same agreed task. A fixed lens can be evaluated against a depth coverage requirement. A synthetic aperture proposal should additionally demonstrate the required position information, timing, motion tolerance, data availability and processing latency. These are proposed review questions; this article does not claim ALEVA implements the cited method.
A proposed OEM acceptance record
Geometry: identify the probe and lens revision, target dimensions and orientation, medium, temperature, positioning fixture, depth and lateral location. Sample the intended depth range, not only the best focal position.
Acquisition: retain the transmit setting, receive settings, focusing configuration, gain and processing revision. Record changes that could affect comparisons.
Measurement definition: name the signal domain, normalization reference, amplitude or power convention, threshold and interpolation method. Keep the underlying profile alongside the reported width.
Repeatability: repeat after removing and repositioning the probe. Report the observed spread and sampling limitations before treating a small width difference as a design improvement.
Decision: agree depth-specific acceptance criteria and the required supplementary checks before testing. Treat an acceptable width as evidence for that defined measurement, rather than a complete assessment of image quality.
The useful deliverable is a traceable response-versus-position record with an explicit width definition. That gives a probe designer, system integrator and OEM reviewer a common basis for choosing the next prototype. For a non-confidential discussion of requirements and deliverables, see ALEVA's custom probe development scope. For a related measurement boundary, see probe termination and the measurement boundary.
Sources and scope
[1] Jackson SJ, Russell S. A precise, reproducible method for measuring ultrasound probe slice thickness using a Gammex 403 phantom. Ultrasound 27(3):148–155. First published February 14, 2019. Peer-reviewed journal article. DOI: 10.1177/1742271X19830742.
[2] Liu Z et al. Assessment of Reflection-Mode Imaging Performance for Ultrasound Computed Tomography Using Tissue-Mimicking Phantoms. Bioengineering 13(11):1321, November 7, 2026. Peer-reviewed journal article; evidence limited to the reported system and experiments. DOI: 10.3390/bioengineering13111321.
[3] Murakami R et al. Elevational Synthetic Aperture Focusing for Rotated Array-Based Three-Dimensional Ultrasound Imaging. IEEE Access 13:45458–45467, March 10, 2025. Peer-reviewed journal article; the PMC copy is an author manuscript of the published paper, not an unreviewed preprint. DOI: 10.1109/ACCESS.2025.3549638.
Author: ALEVA — Orange County, California, USA. The figure and numerical example are original analytical illustrations. The acceptance record is a proposed engineering framework, not measured ALEVA performance, clinical guidance or a certification claim.