Ultrasound Engineering
Ultrasound Hydrophone Measurements: Separate Frequency Response from Spatial Averaging
A practical OEM measurement framework for separating hydrophone frequency response from finite-aperture spatial averaging, with a reproducible educational calculation and dated public sources.
ALEVA · Orange County, California, USA
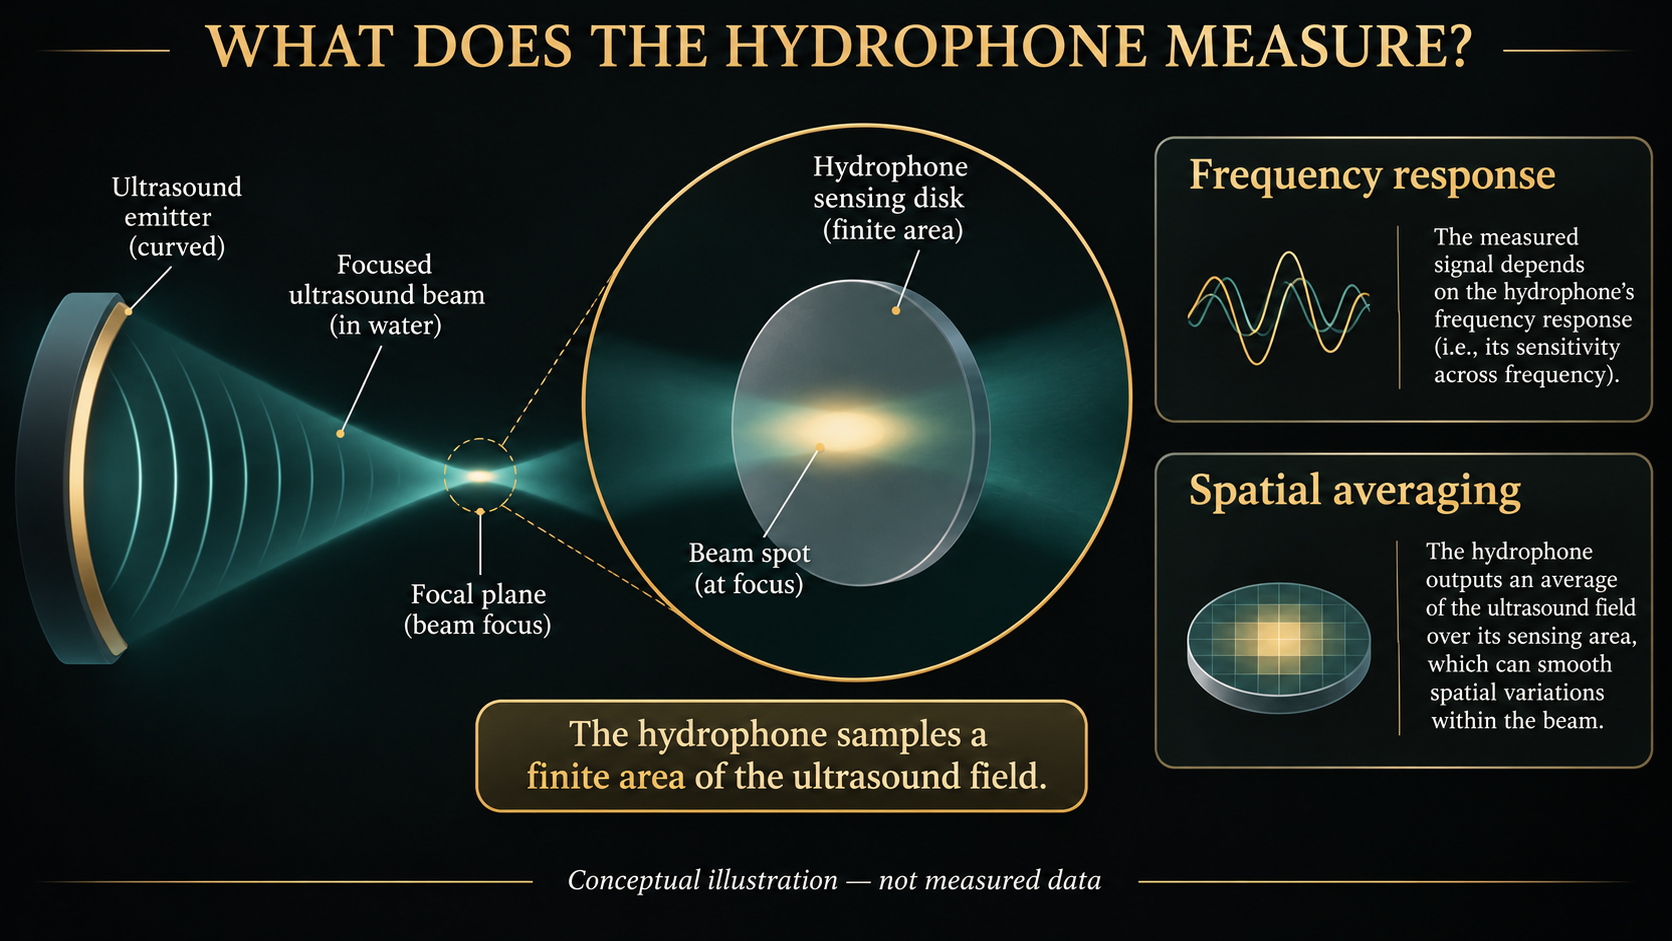
Conceptual illustration of a finite hydrophone sensing area and two measurement effects. Not measured data, a quantitative simulation, or evidence of product performance.
Engineering question: If two hydrophones report different focal pressures from the same ultrasound probe, is the probe changing, or are the sensors measuring different spatial and spectral versions of the field?
A calibration certificate is essential context, but it does not make a finite sensor a point receiver. Before accepting a probe revision or comparing supplier measurements, define which pressure quantity is required and how the measurement chain estimates it.
Two effects belong in separate checks
Frequency-dependent sensitivity changes how acoustic frequency components become voltage. Spatial averaging combines contributions across a finite sensitive region. The 2023 review by Harris and colleagues treats corrections for these effects separately, alongside measurement uncertainty. A frequency-response correction alone should therefore not be presented as proof that the local spatial peak has been recovered. [1]
NPL offers both magnitude and phase calibration options, as well as directional-response measurements. For an OEM measurement specification, identify the calibration data actually supplied and the frequency band used in reconstruction. Do not silently substitute a single nominal-frequency sensitivity for a documented broadband measurement method. The NPL service page is an undated service description, not a new product announcement. [2]
Nominal diameter is not the complete spatial specification
Wear, Fury and Alvarenga’s peer-reviewed 2025 study describes frequency-dependent effective sensitive-element size inferred from needle-hydrophone directivity. Its central distinction is between geometrical diameter and effective diameter; the two need not agree, particularly in the low-frequency regime investigated. This is a reason to request applicable directivity or effective-size information rather than treating the diameter printed on a specification sheet as a universal spatial-resolution guarantee. The study concerns needle hydrophones and is not a universal correction for every sensor construction. [3]
A reproducible illustration of averaging
Consider an idealized circular sensor of radius a, centered on a radially symmetric, in-phase pressure-amplitude distribution p(r) = p0 exp(−r²/(2s²)). Assume uniform sensitivity across the disk, no noise and no perturbation of the field by the sensor. Integrating over the disk gives:
p_average / p0 = (2s²/a²) × [1 − exp(−a²/(2s²))]
For a/s = 0.5, 1 and 2, the calculated ratios are approximately 0.940, 0.787 and 0.432. The source peak p0 is unchanged; only the averaging aperture changes. Here s is the Gaussian amplitude-profile scale, not a measured beamwidth.
This educational calculation is not a hydrophone calibration or a correction factor for an ALEVA product. It excludes diffraction, spatial phase variation, frequency-dependent effective aperture and nonlinear propagation. Its purpose is to show why a lower measured peak does not, by itself, establish lower source output.
Correction trades bias against model dependence
Alves and colleagues’ peer-reviewed February 2026 paper proposes a simulation-derived empirical spatial-averaging correction and discusses the sensitivity compromise associated with smaller hydrophones. That work supports evaluating a correction method within its studied assumptions; it does not justify applying one multiplier to every beam and waveform. The public abstract was reviewed for this article; no independent reproduction of the method is claimed. [4]
An OEM acceptance record that can be reviewed
Our proposed handover record separates three outputs: the captured voltage waveform, the result after the documented sensitivity correction, and any result after an additional spatial correction. Attach the sensor identity, calibration revision, amplifier and digitizer configuration, alignment procedure, water conditions, transmit configuration, correction assumptions and uncertainty estimate.
For a disputed difference between probe revisions, repeat the positioning and acquisition before interpreting the difference. Where practical, compare an independently characterized sensor or an alternative validated measurement method. Set acceptance limits for the intended quantity and its uncertainty before reviewing the result. These are proposed engineering review steps, not a completed ALEVA validation report.
The OEM decision is whether the evidence can distinguish a source change from a measurement-chain change. That distinction belongs in the agreed verification scope for ultrasound transducer manufacturing and OEM ultrasound development.
Sources and publication status
Harris GR et al. Hydrophone Measurements for Biomedical Ultrasound Applications: A Review. IEEE TUFFC 70(2), 85–100, February 2023. Peer-reviewed review. DOI: 10.1109/TUFFC.2022.3213185.
National Physical Laboratory. Hydrophone calibration services. Official service documentation; publication date not stated; accessed November 15, 2026.
Wear KA, Fury CR, Alvarenga AV. Spatial Resolution Limits for Needle Hydrophones From 0.5 to 20 MHz With Implications for Transcranial Ultrasound. IEEE TUFFC 72(11), 2025; first published September 16, 2025. Peer-reviewed research. DOI: 10.1109/TUFFC.2025.3610361. Public NPL-hosted paper.
Alves F, Santos M, Alvarenga A, Petrella L. Empirical correction method for spatial averaging effect in ultrasonic device calibration: Enhancing the precision-sensitivity trade-off. JASA 159(2), 1027–1035, February 2026. Peer-reviewed research; abstract-level review here. DOI: 10.1121/10.0042356.